

If you deal with Machine Learning models, either as a data scientist or department manager, one of your major concerns is probably ROI. For the 2 main types of use cases – automation and prediction – this requires a unique approach. For each one, we will highlight key points to keep in mind in their life-cycle and how to address them.
Let’s take a quick look at the typical stages in an ML use case:
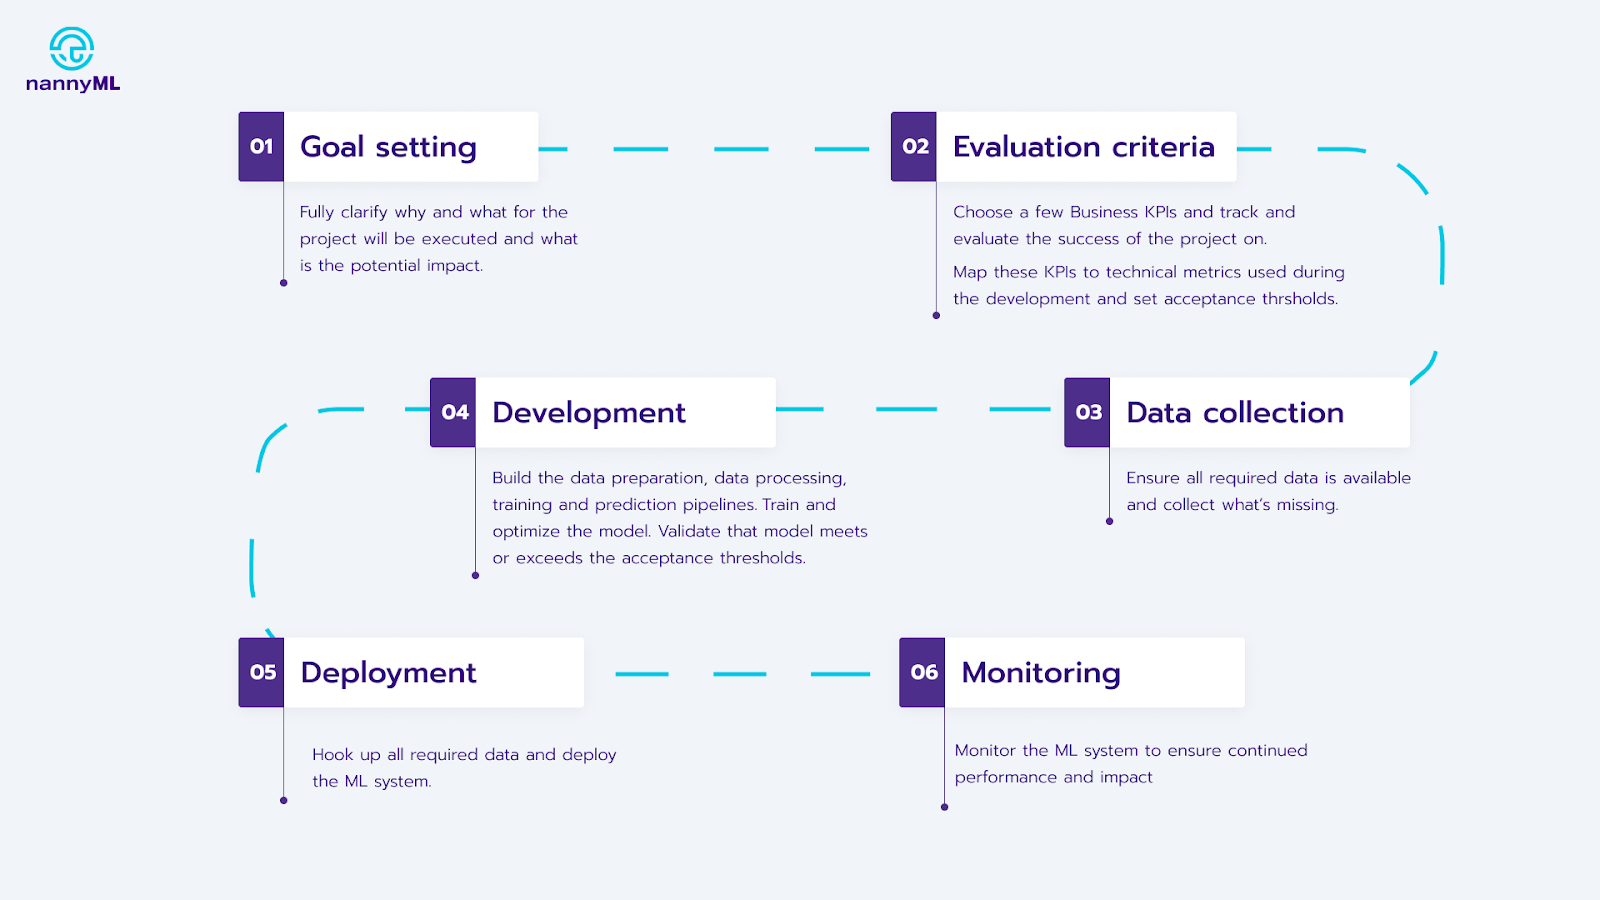
Typical steps when implementing a new ML use case
The typical life-cycle is the same for both automation and prediction:
- Choose the goal
- Establish the evaluation criteria
- Collect data
- Develop the ML system
- Deploy the system
- Monitor the system
However, they have distinct caveats that can cause delays in your project, decrease business efficiency, or cancel the use case entirely. Let’s delve into it!
1. Goal setting
Automation use cases replace or augment humans doing a manual and repetitive process. Some tasks that can be automated are:
- Extracting key facts from a claim statement
- Pricing insurance policies
- Estimating damage from a car crash image
A key characteristic here is that once you deploy the models, you cannot verify the predictions against reality. The model determines the reality – if you price an insurance policy at 10 Euro a month, you will never directly learn that the ‘correct’ price was 12 Euro a month.
Prediction use cases usually model an event or metric from the future to change it or to adapt to it. Things you might want to predict are:
- Demand for your product
- Stock market behavior
- When to maintain a plane engine (predictive maintenance).
In contrast to automation, you can verify these outputs against reality. It’s straightforward to spot that last week’s demand forecast for pomegranates was off by 10%. You can simply compare it with the actual demand at the end of the week.
Side note: some use cases don’t fit well into one bucket, such as fraud detection. We only get the ground truth about the transactions we flag as fraudulent, but not those we flag as normal. As it is harder to get to the ground truth, it makes sense to treat these kinds of cases as automation.
This key difference is being able to verify the quality of your model outputs relatively soon after they are made and with little effort. This has far-reaching consequences for the entire life-cycle of these models.
2. Evaluation criteria
What do we want to achieve and how will we measure success? There are two types of evaluation criteria: business KPIs and technical metrics. Business KPIs measure the impact of the use case in terms of ROI, while technical metrics are used to develop and evaluate the model.
Here’s how these metrics are normally defined:
- Start with a business case and gather data about costs, benefits and trade offs, and put dollar amounts for everything.
- Choose the most important business KPIs to track and optimize for
- Translate the above business KPIs into technical metrics
Let’s go through the steps using a typical automation use case: document classification into 2 classes – relevant or irrelevant.
- We want to reduce labour required to classify documents and preserve the quality of the classification. This one-sentence summary already describes the vital trade-off you have to consider – personnel costs vs quality. You could automate all processing, but then the quality is likely to suffer. Or you could keep doing the work manually, but that costs a lot. Let’s quantify this trade-off, for example like this:
- Classification cost per document:
- Human – 5 Eur
- Machine – 0.05 Eur
- Error cost per document:
- Relevant document classified as irrelevant ~ 50 Eur
- Irrelevant document classified as relevant ~ 1 Eur
- The most important KPIs could be:
- Average processing cost per document
- Average error cost per document
- Total expected cost per document (function of 1 and 2)
- The system you’re designing will need to make 2 separate decisions:
- Classification into relevant / irrelevant. Here we can use a typical ML metric measuring the quality of predictions, such as f-beta score. The f-beta score allows you to adjust the weight of false positives and false negatives to reflect business costs.
- Double check with a human. Here the algorithm will decide whether it should have the prediction double checked by a human or not. To accomplish this, it will need an objective function to make this decision, which should consider the costs of human reevaluation and average error cost per document. For every document analyzed, the algorithm will estimate the expected cost of error and will decide whether double checking with a human would reduce the total cost.
Now that key business KPIs have been established in terms of cost, and translated into technical metrics, we’re ensuring that the model optimizes for ROI like it should. However, the mapping between the KPIs and the technical metrics might change in time, once the model has been deployed. This means that the ML system might become less effective as time passes, as it has been optimized (and evaluated) based on a set of criteria that no longer correctly represents business KPIs and goals. Let’s discuss what the typical business KPIs are for automation and prediction, and how their correlation with the technical metrics might plummet after deployment.
In automation, the technical metrics may inaccurately approximate these KPIs when the cost structure of the labor changes. If the salaries of insurance analysts increase, while the costs of incorrectly priced policies remain the same, the technical metrics no longer correctly represent the tradeoff between these costs and the output quality.
The ROI of prediction use cases is measured by the value these predictions bring to the business, and how well the organization responds to the changing environment. As with the automation example, these business KPIs can change. As market conditions evolve, the correlation between these KPIs and the technical metrics is likely to decrease. If the costs of customer acquisition increases, it makes sense to increase retention efforts, as well as change the technical metrics to reflect that.
3. Data collection
Data for both types of use cases is normally available as a historical record. The difference lies in collecting more data. For prediction, our only option is to wait and record events we want to predict. For automation, we can create more examples manually, which is faster, but also significantly more expensive.
4+5. Development and deployment
Development and deployment is the stage where differences between automation and prediction are the least pronounced. So let’s move on to monitoring.
6. Monitoring
Along with goal definition, monitoring is the stage where the differences between automation and prediction are the most visible. Let’s go over two primary goals of monitoring – performance evaluation and retraining – and compare how to achieve each one.
Performance evaluation
Performance evaluation tracks the technical and business metrics of the ML use case. Let’s start with the technical metrics. Tracking them is challenging for automation use cases, as you do not get the ground truth (labels) at all – doing the same work as the algorithm would defeat the purpose of the use case. There are still two ways to estimate performance: spot checks and predictive performance estimation. We will dive into them in a second.
For prediction, technical performance evaluation is relatively straightforward as you have access to the ground truth. Things get interesting when there’s a significant delay between the prediction and ground truth. Let’s say you’re creating an ML system to predict mortgage defaults. Depending on specific business context, the ground truth only becomes accessible in a few months or even years. A lag like that is not acceptable, so you need to find another way.
For business metrics, the ease of access and delay varies from use case to use case. If the business metrics are available, the relationship between them and technical metrics should also be monitored to ensure that they are aligned and business value is maximized.
Spot checks
Spot checks are a manual validation of model output on some subset of data. To do a spot check in an insurance policy pricing use case, an analyst would manually double check the output of the system. While doing a spot check is straightforward enough, trade-offs involved in choosing the sample size, the sampling method, and other parameters, are complex and hard to navigate. The good thing about spot checks is that you can do them for automation cases. We’ll explore them in another blog post.
Predictive performance estimation
If the ground truth does not exist (or is delayed), you can still examine model inputs, model outputs, and some real world responses to the prediction. Using machine learning and statistical algorithms on those, you can estimate the performance of the ML system on the aggregate. Using the insurance pricing example, you would collect all relevant data about the applicants (model inputs), the policy prices (model outputs), and some form of market response such as sign-up rates. Then we’d estimate business and technical metrics on the aggregate level.
Estimating performance in the absence of ground truth is still an open problem not only from an industrial but also research perspective, and we expect to see rapid improvement in the state-of-the-art of predictive performance estimation techniques in the coming years. Stay tuned for a more technical blog about it!
Retraining
If model performance decreases, the first thing that you should do is retrain the model incorporating new data into the training set. While this is ideal, it’s not guaranteed to work, as the new patterns in data might require a different model architecture or approach. In that case, the data science team would need to redo all the steps above and create a new model. Now let’s discuss what retraining looks like for automation and prediction.
On top of being harder to evaluate, automation systems are almost always more expensive to re-train or re-develop. This is because the data labelling needed for that is both time and resource intensive. With this in mind, we want to retrain models only when necessary, so accurate performance evaluation is even more important.
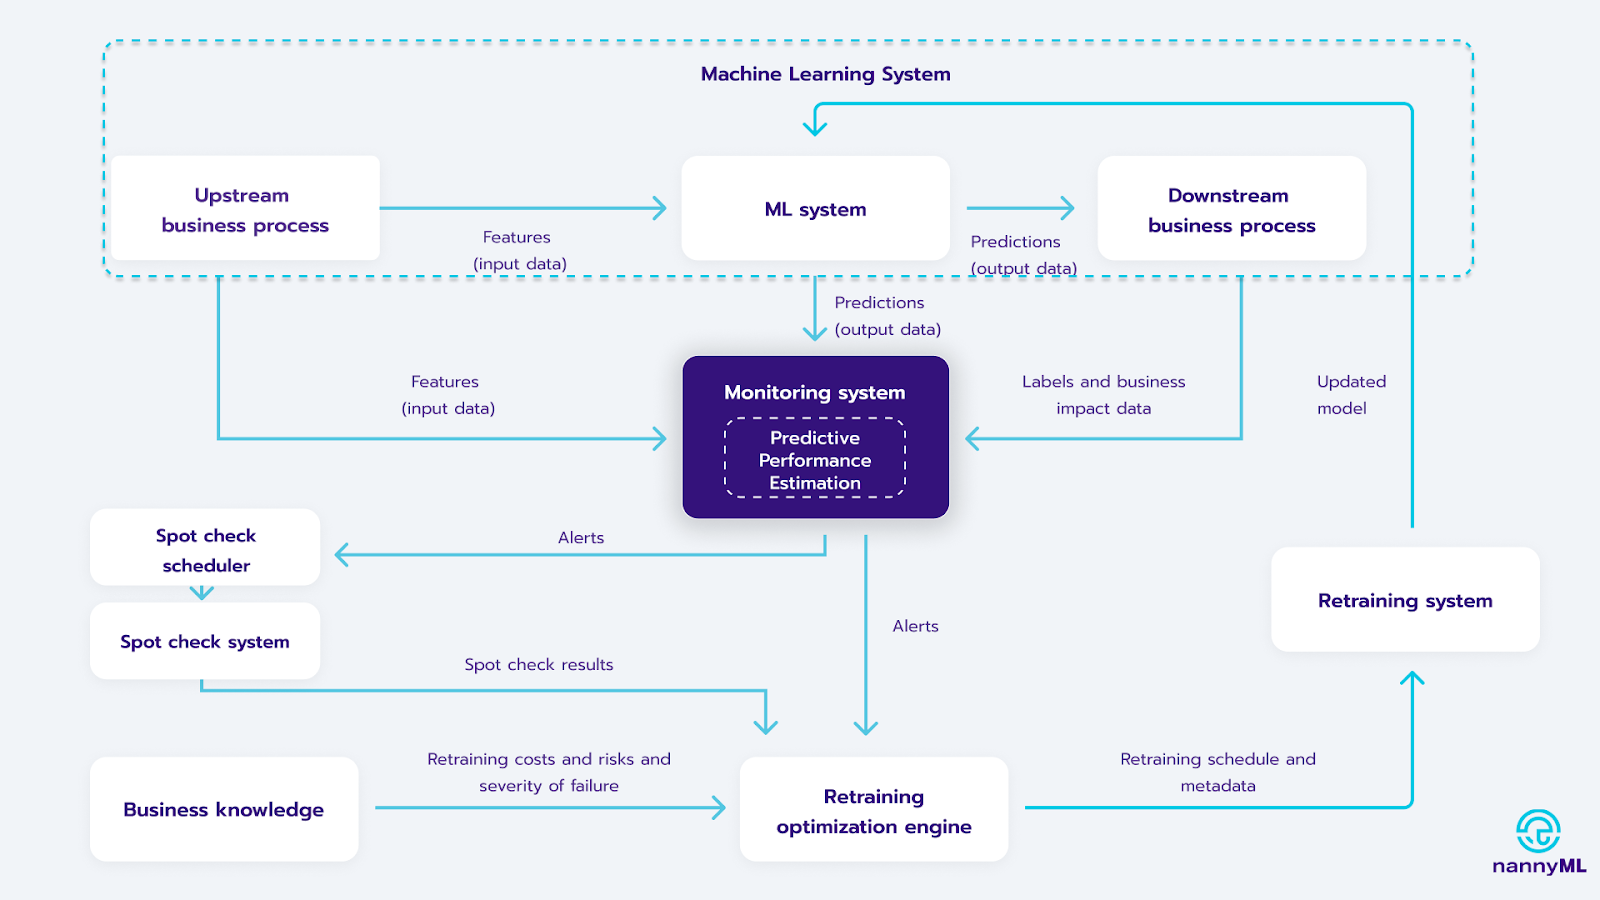
A good monitoring system should tell you when to retrain and how. An ideal retraining loop would include a monitoring system with predictive performance estimation, a spot check system, and the retraining loop. A framework is in the picture below. We will cover re-training more in depth in a dedicated post, as it is a very complex topic.
Closing words
For long-term success, you need to have a deep understanding of automation vs prediction and how to solve their respective challenges. In a nutshell: automation use cases are harder because you have limited access to the ground truth once you deploy a model. This is especially true in the goal setting and monitoring stages, arguably the most impactful and overlooked stages. There are solutions that can help though, such as spot checks and predictive performance estimation. Monitoring the relationship between business and technical metrics is essential to establish the trust that should exist in your use cases to keep generating a good ROI.


.avif)