
Do not index
Canonical URL
Starting from version 0.8.6, NannyML supports features to monitor your data quality. In this version, we added two new calculators, one for monitoring missing values (
MissingValuesCalculator) and another for monitoring unseen values (UnseenValuesCalculator).These two methods not only allow us to gather statistics on missing and unseen values, which are often straightforward to calculate, but they help us measure what the baseline amount of missing/unseen values is within a known dataset (a.k.a reference) and monitor the production data against these baselines.
In this tutorial, we will use the Marketing dataset to show how to use these calculators and learn how to interpret their results in a practical case.
Installing NannyML
If you haven't installed NannyML in your environment, you can do it by using pip or Anaconda.
Pip
To install NannyML via pip, use the following command:
pip install nannymlAnaconda
To install NannyML via Anaconda, use the following command:
conda install -c conda-forge nannymlLoading Required Libraries
In this tutorial, we will use Numpy, Pandas, and NannyML.
import numpy as np
import pandas as pd
import nannyml as nml
Load the Data
The Marketing dataset is a collection of survey responses from shopping mall customers in the San Francisco Bay Area. It was designed to predict a household's Annual Income using demographic attributes such as marital status, age, education, etc.
We split the dataset into two parts: reference and analysis. We will use the reference set to calibrate NannyML methods. Ideally, the reference set mimics the real world data as close as possible. So, it tell us how what is the acceptable rate of missing/unseen values.
Then, we use a subsequent dataset, that we call analysis to check if this new data conform with our expectations. The analysis set can be any production data that you want to monitor.
data = pd.read_csv('marketing.csv', dtype='category')

reference = data.iloc[0:int(len(data)/2)]
analysis = data.iloc[int(len(data)/2): -1]

features = ["Sex",
            "MaritalStatus",
            "Age",
            "Education",
            "Occupation",
            "YearsInSf",
            "DualIncome",
            "HouseholdMembers",
            "Under18",
            "HouseholdStatus",
            "TypeOfHome",
            "EthnicClass",
            "Language",
            "Income"]
Missing Values
Checking missing values in a dataset is relatively straightforward. Usually, we just need to use the pandas’
isnull() method.For example, to count how many missing values are in the reference set, we can do the following:
reference.isnull().sum()YearsInSf 496
HouseholdMembers 175
TypeOfHome 175
Language 136
HouseholdStatus 114
Occupation 69
MaritalStatus 62
EthnicClass 40
Education 29
Sex 0
Age 0
DualIncome 0
Under18 0
Income 0
dtype: int64We see that it is normal to have missing values, and it is easy to count them, but what if, for the analysis set, we start getting more and more missing values than expected? How can we calculate what the expected and acceptable missing value rate is?
Here is where the NannyML’s
MissingValuesCalculator() can help. Let’s see how to use it.Monitoring Missing Values in Production
NannyML’s methods have a sckit-learn styled interface. Where we instantiate a method, fit it on a dataset, and then use it to calculate/estimate a metric.
The code snipped below shows how to use the
MissingValuesCalculator() method. The only required parameter is the column_names, which is a list of all the columns we want to check for missing values. Once the calculator is fitted, we can use it to calculate the rate of missing values on the analysis set.# instantiate the MissingValuesCalculator class
calc = nml.MissingValuesCalculator(column_names=features)
# fit the calculator on the reference set
calc.fit(reference)
# calculate the rate of the missing values on the analysis set
results = calc.calculate(analysis)
results.plot()When we plot the results, we get the following.
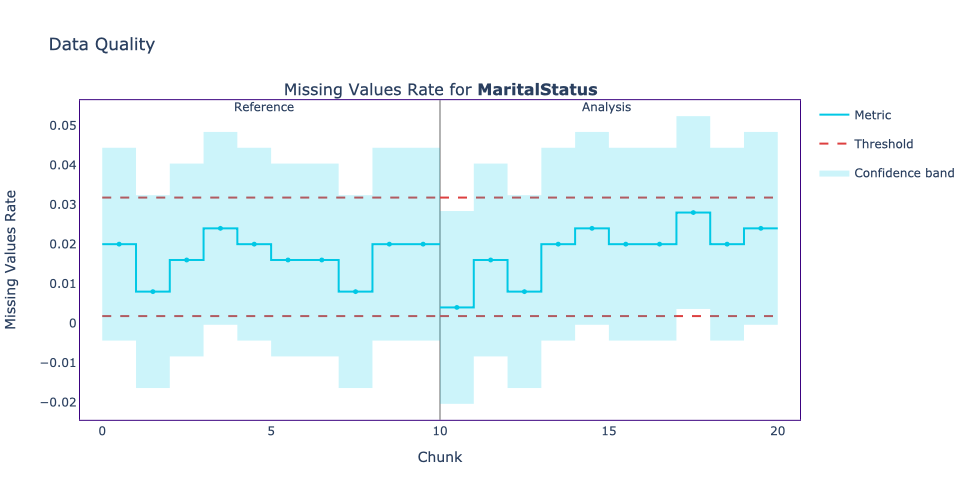
We see that the MaritalStatus column contains missing values during both the reference and analysis periods. The red horizontal lines are the thresholds, they were computed based on the reference data, and since the number of missing values during the analysis period is inside these thresholds, we conclude that the rate of the missing value for the MaritalStatus column has its expected behavior.
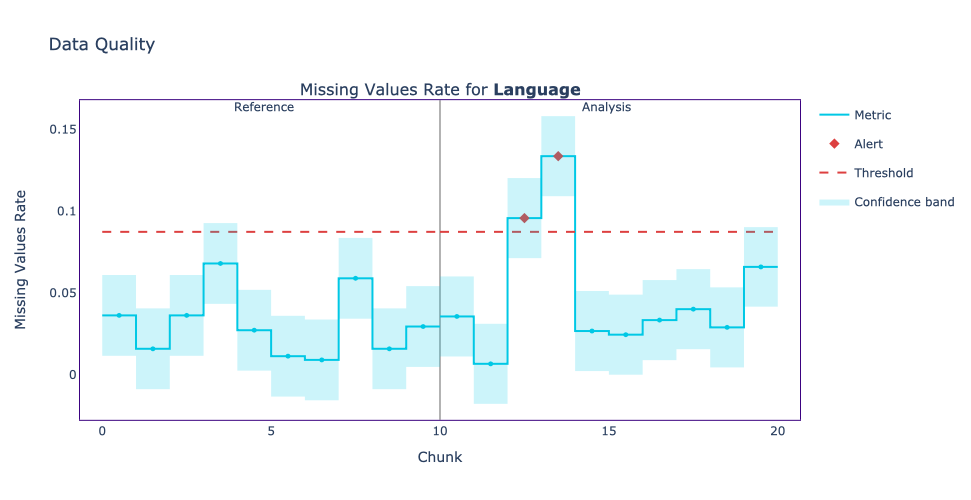
If a value surpasses the thresholds, NannyML will show an alert, telling us there is an unfamiliar amount of missing values in a specific period. An example of a column showing more missing values than expected is the Language column.
A column without any missing value would look like the following.
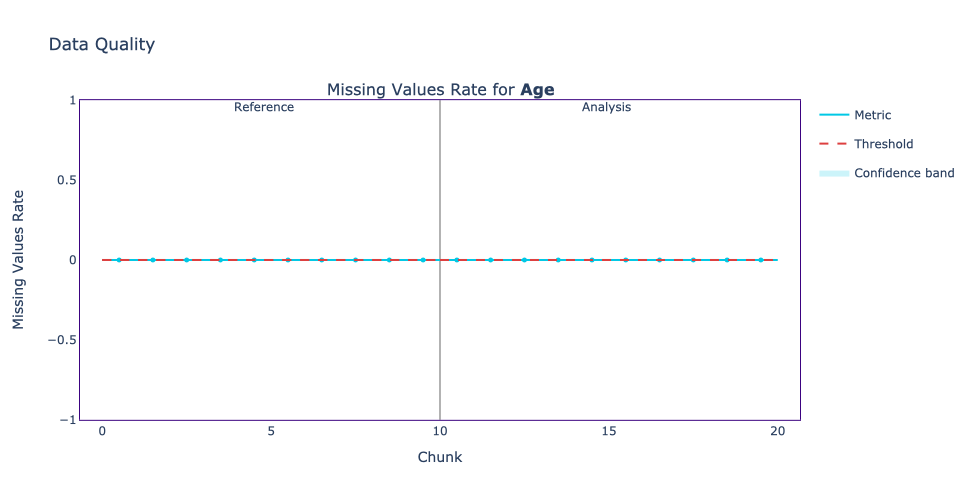
The Age column doesn’t have any missing values. Maybe it was a mandatory field in the Marketing Survey, so no missing information is shown.
To learn more about the
MissingValuesCalculator and its parameters, check out its API reference.Unseen Values
The unseen values calculator works similarly to the missing values one. With one main conceptual difference, the notion of unseen values only makes sense for categorical variables.
NannyML defines an unseen value as a categorical value that appears in production data but not in the reference period. So, if a new unseen value shows up NannyML will alert us.
Let’s see how to use the
UnseenValuesCalculator method.Monitoring Unseen Values in Production
Just as with the missing values calculates, we instantiate the
UnseenValuesCalculator method, fit it on the reference set and calculate the rate of unseen values on the analysis set.# instantiate the UnseenValuesCalculator class
calc = nml.UnseenValuesCalculator(column_names=features)
# fit the calculator on the reference set
calc.fit(reference)
# calculate the rate of the unseen values on the analysis set
results = calc.calculate(analysis)
results.plot()When we plotted the results for the Marketing dataset, we realized that the only column with unseen values was the TypeOfHome column.
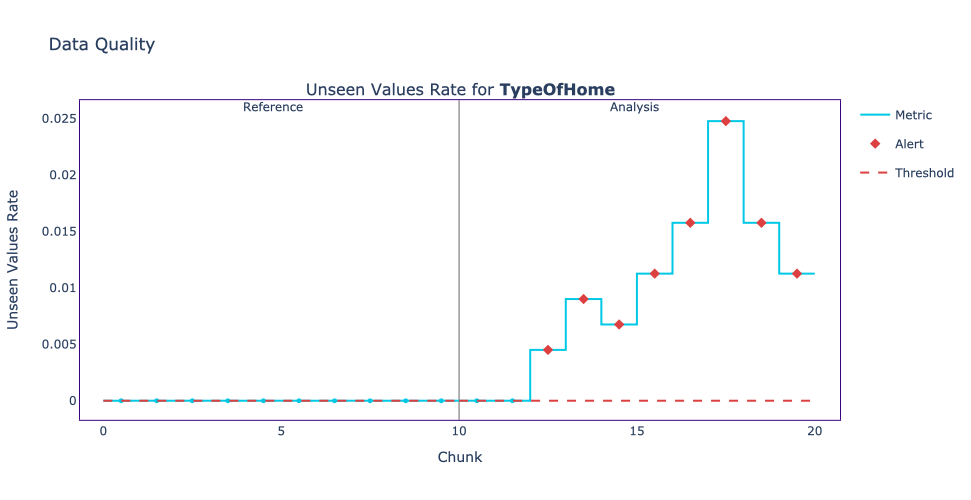
It looks like, at some point in the survey, a new type of home became available as an option.
An unexpected increment of unseen values in your model input can make your model less confident in the regions containing these values, so it is always important to know how to deal with these changes. To learn more about the
UnseenValuesCalculator and its parameters, check out its API reference.The notion of calculating missing and unseen values is simple, but what NannyML’s methods bring to the table is an easy way to determine what an unexpected rate of missing and unseen values is. So, you can easily tell if your model inputs contain more missing and unseen values than usual!
If you want to learn more about NannyML’s data quality checks or have any questions join our Slack Community!
We are fully open-source, so don't forget to spread some love by leaving us a star on GitHub! ⭐

Written by
